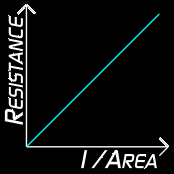
If we plot a graph to show how resistance varies with 1/area, we find:
Like the length graph, the line passes through the origin. This tells us that however much we increase the cross-sectional area, the resistance will decrease by the same amount.
|

