Voltage & Current Graphs Summary
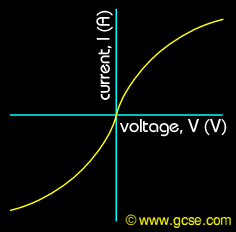
Plotting graphs of current (I) against voltage (V) shows how a component behaves.
For resistance wire (at constant temperature) the resistance is constant, so the graph is a straight line through (0,0):
For filament lamps, the temperature increases dramatically with increasing current, so the resistance changes and the graph is a curve:
For diodes, they only allow current to flow one way through them, so have a zero region for this reverse voltage.
Diodes also have a strange flat region before they "switch on" allowing current to flow.
RELATED TOPICS:
|


